Infographic
Software


Goal
Research and develop an infographic to inform and promote an important cause. Balancing graphical imagery, data design, and type, engage the audience in an intellectually informative and visually engaging display.
Sketch
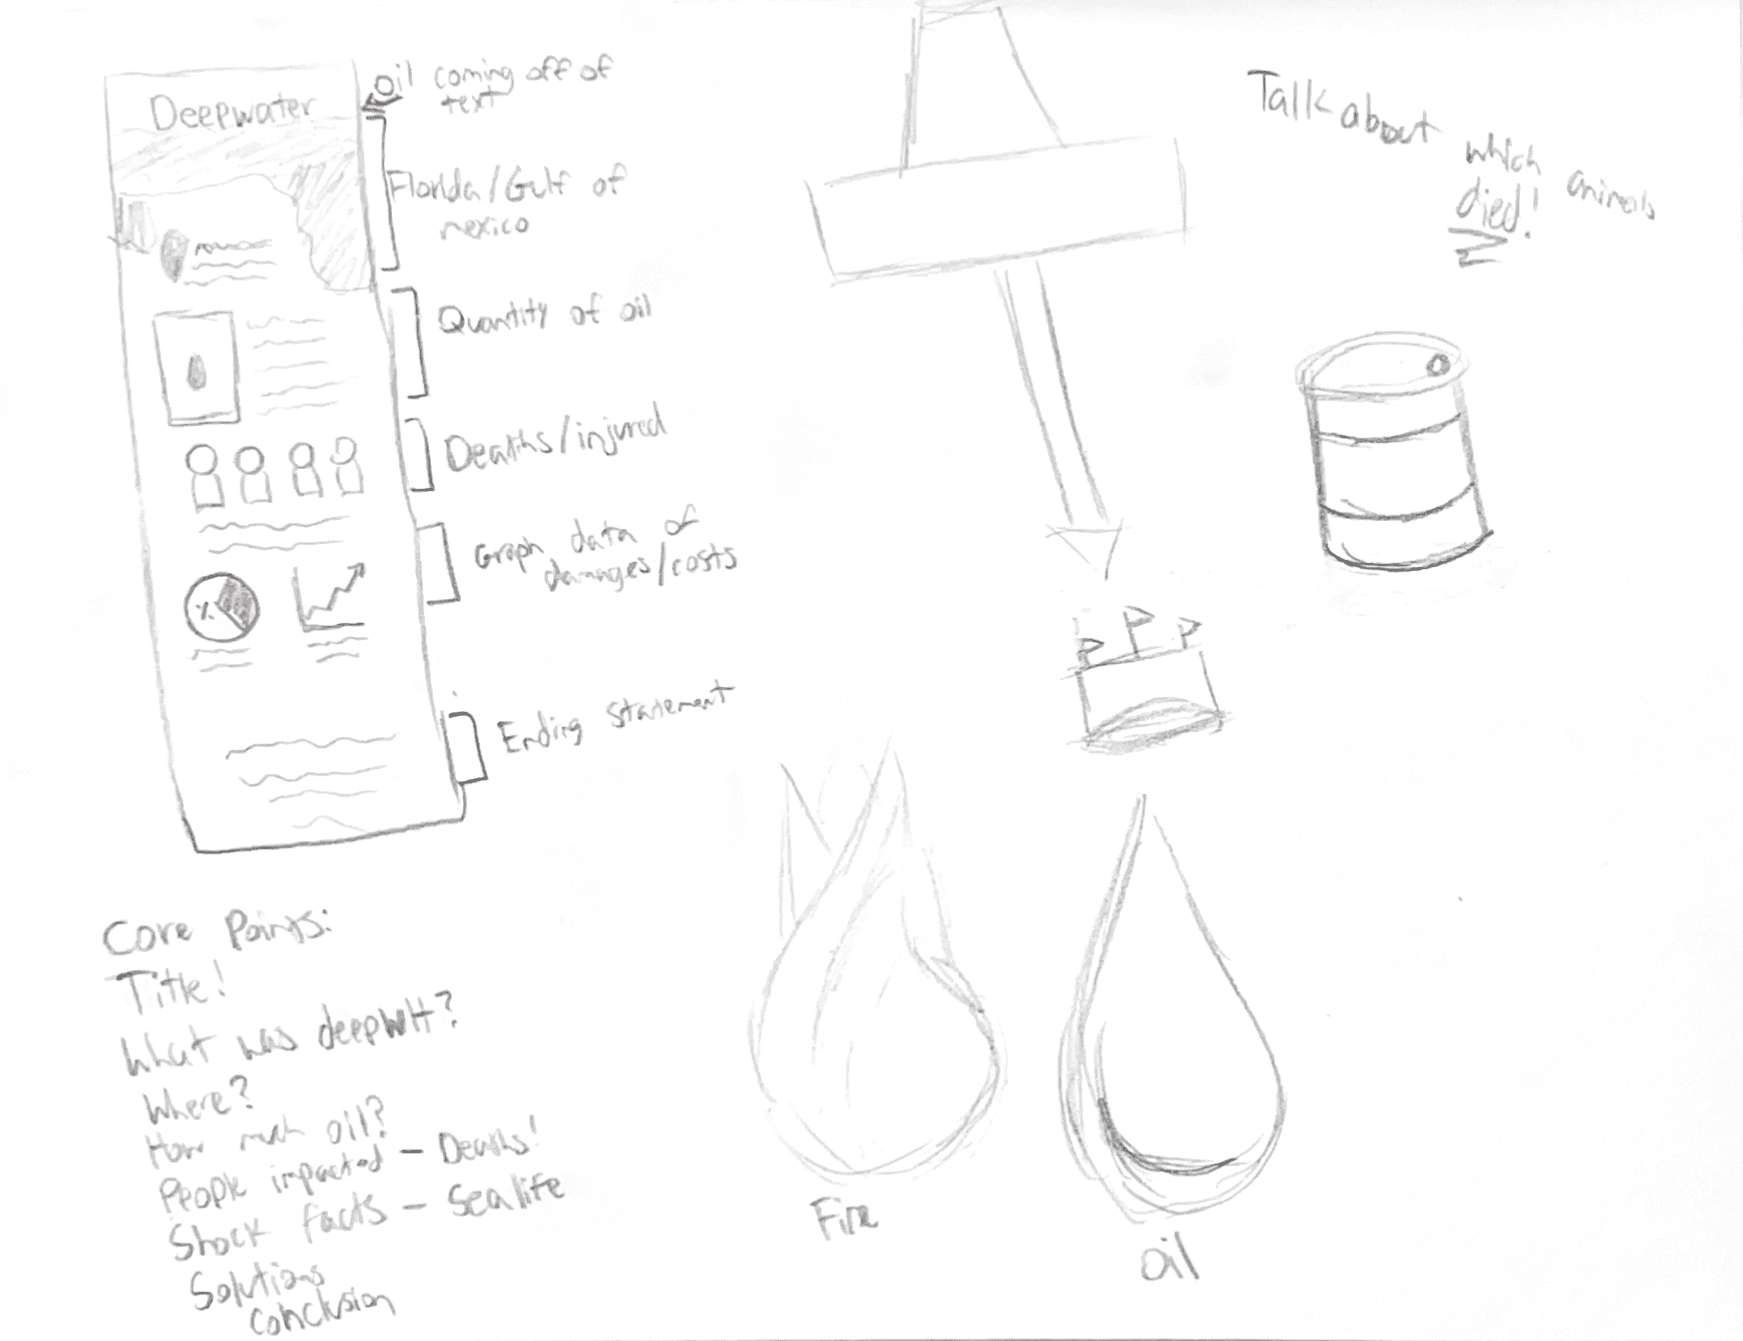
A large focus of mine was communication through graphics. I used analogies that would create perspective to the user. The oil lost on Deepwater Horizon is inconceivable, but when shown in a metric as cars fueled, it is put to scale.
Research
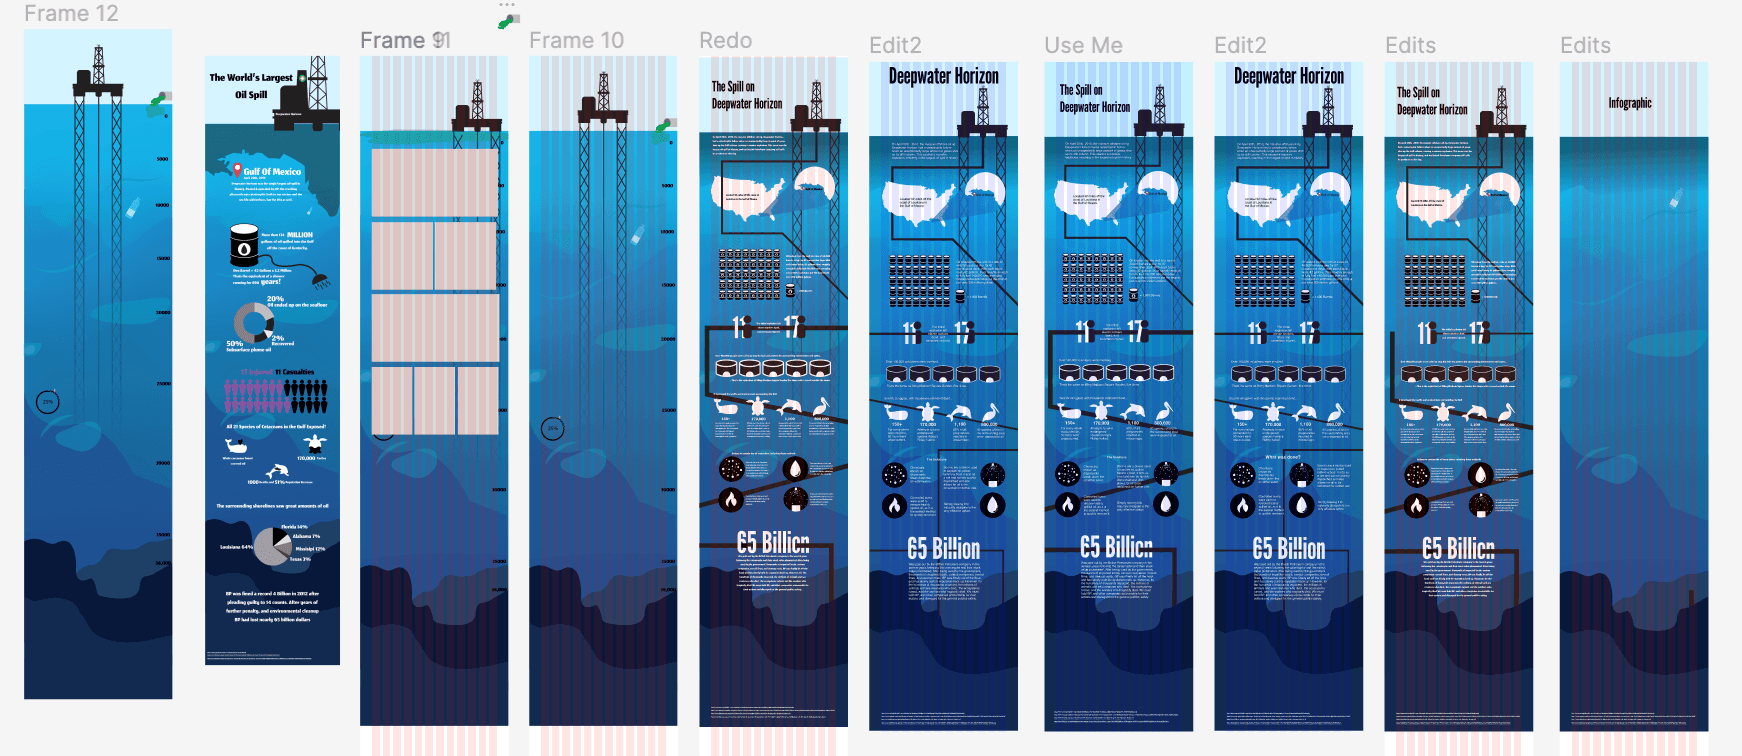
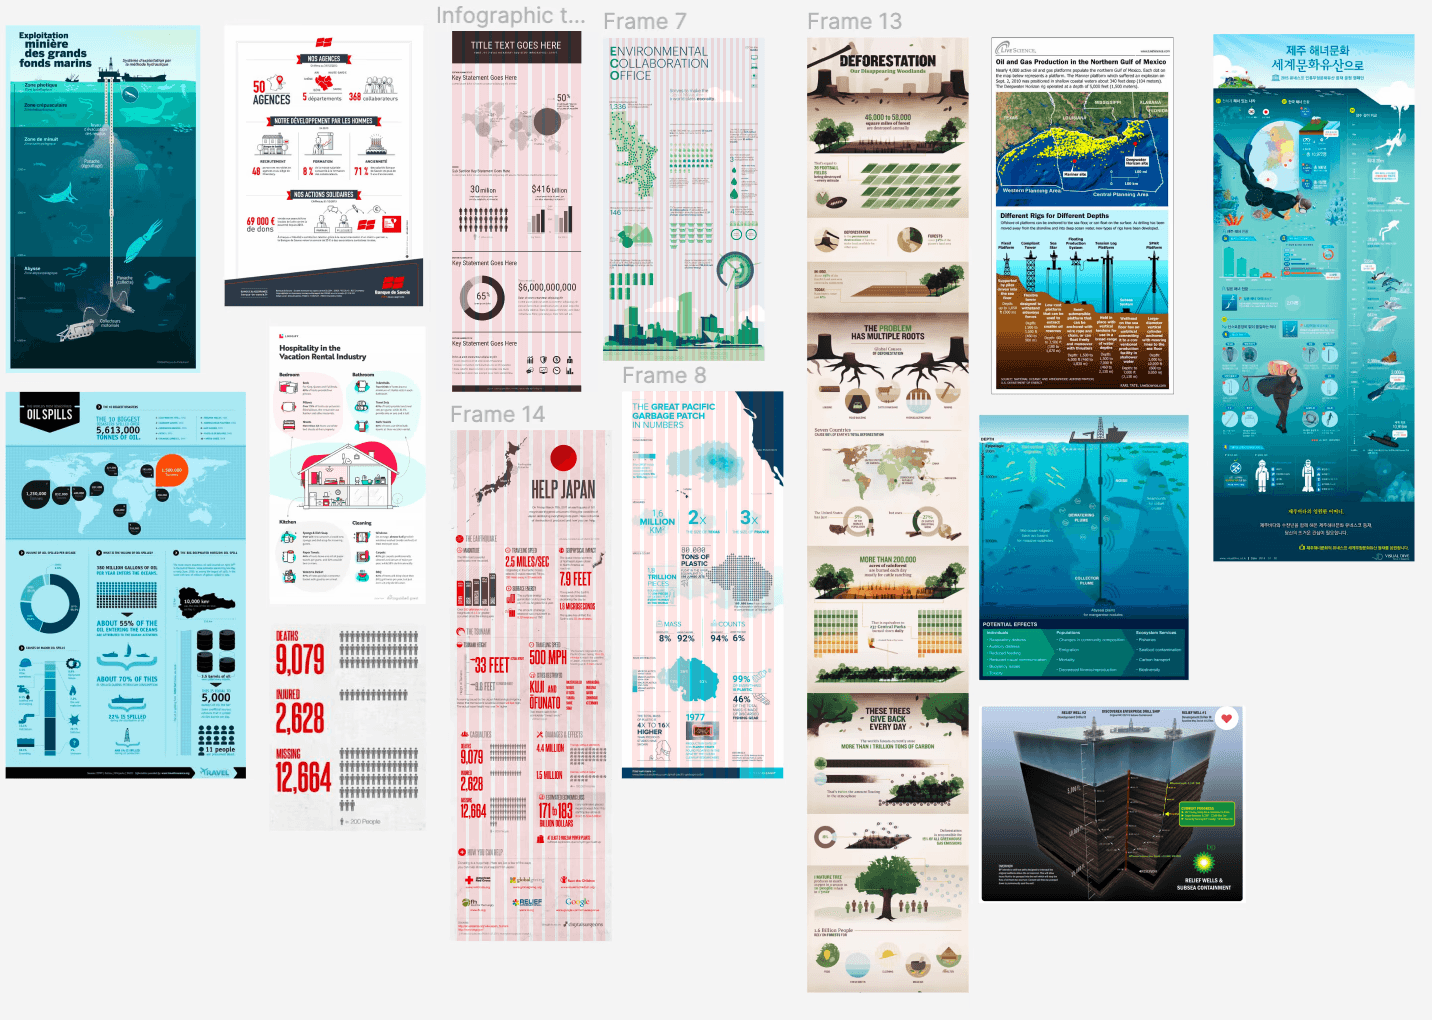
Approaching an ecological style, I targeted natural color palettes that use depth and contrast, knowing I wanted the scene to darken slowly downwards.
Ideation and Process
I began with background, before moving onto experimenting with graphics and layout. My goal was to lead the user through elements using the pipeline, and focusing on a contrasting black and white on blue style. The harsh oil black encapsulates an oil spill, while the white draws focus.
